Statistical Consulting
Dr.rer.pol. Sylvia Tamara Lenz
Master of Science /
Diplom Mathematician (USA)
Dr.rer.pol. Sylvia Tamara Lenz
Master of Science /
Diplom Mathematician (USA)
Examples:
Statistical Analysis of Overall effects and Interaction
Statistical Analysis of Overall effects and Interaction
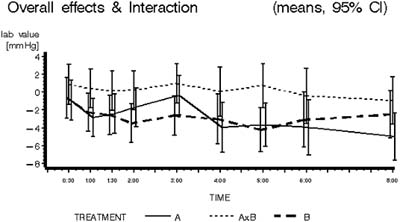
This graph shows the mean and 95% confidence interval over time of treatment A and B, and the interaction (AxB). The interaction is statistically significant at the 5% level when the interval lies entirely in the positive or negative range.